The PFAS problem

Long-lasting chemicals in our water

PFAS are man-made chemicals that barely break down, so they build up in soil, groundwater and drinking water sources, and in our bodies.

The problem

What are PFAS?

Thousands of man-made chemicals built on fully fluorinated carbon chains. The carbon–fluorine bond is the strongest in organic chemistry, so PFAS barely break down.
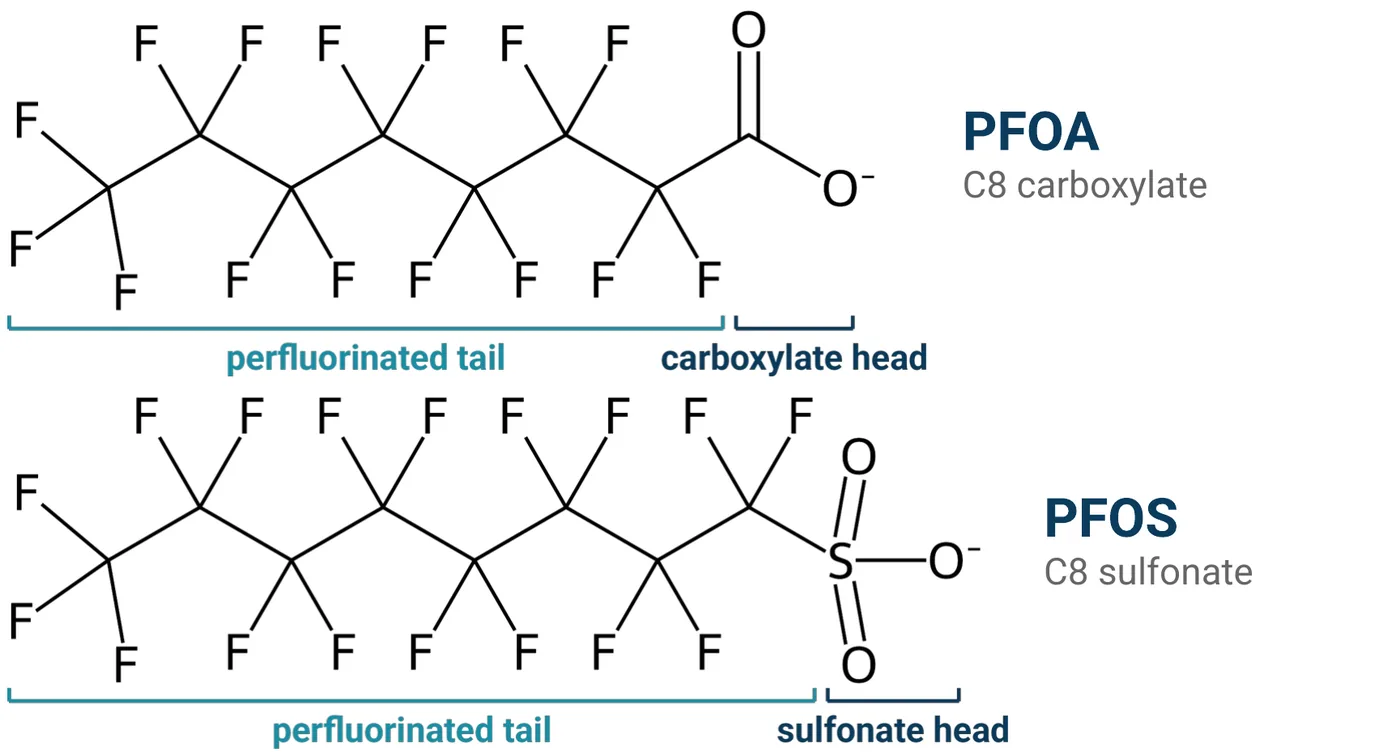
Chemical structures of PFOA, a C8 carboxylate, and PFOS, a C8 sulfonate, each with a perfluorinated tail and a charged head.
The regulated pair. Unique molecular structure promotes their accumulation at interfaces and influences their adsorption behavior onto surfaces. The US limit is 4.0 ng/L each.
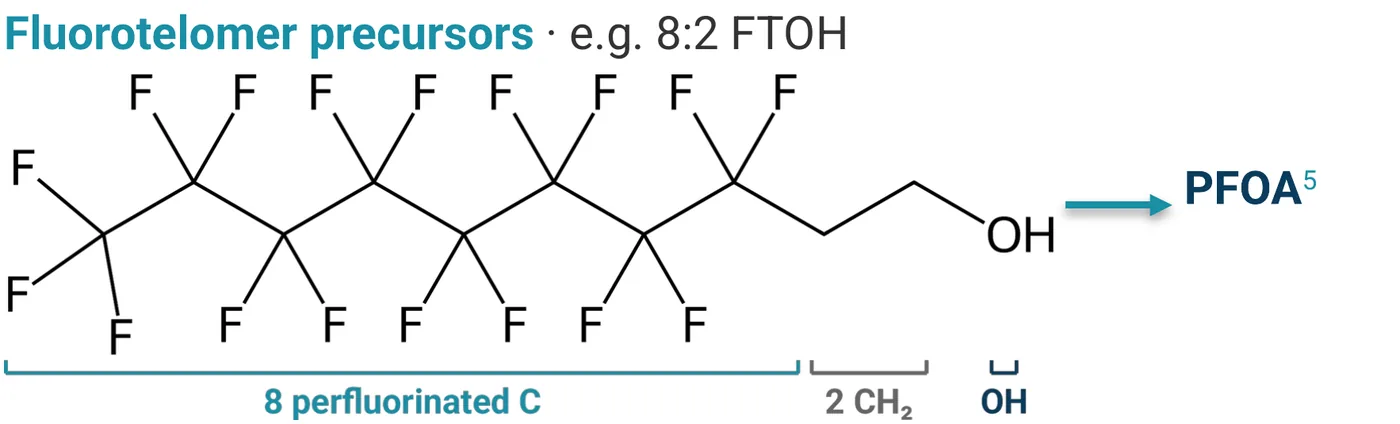
Chemical structure of 8:2 fluorotelomer alcohol: eight perfluorinated carbons, two CH2 groups and an OH group, with an arrow to PFOA.
Precursors such as 8:2 FTOH break down to acids such as PFOA.
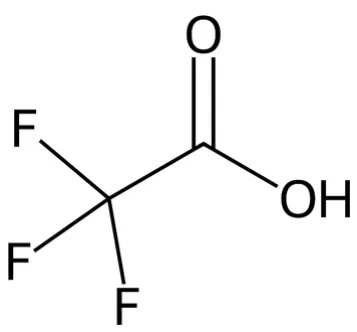
Chemical structure of trifluoroacetic acid (TFA), a two-carbon acid.
TFA, an ultrashort end product, is rising in rain, soil and drinking water.

Sources: Evich et al., Science 375, eabg9065 (2022); O'Hagan, Chem. Soc. Rev. 37, 308 (2008); US EPA, 89 FR 32532 (2024); Ellis et al., ES&T 38, 3316 (2004); Wang et al., ES&T 39, 7516 (2005); Arp et al., ES&T 58, 19925 (2024).

The problem

In us, around us, under us
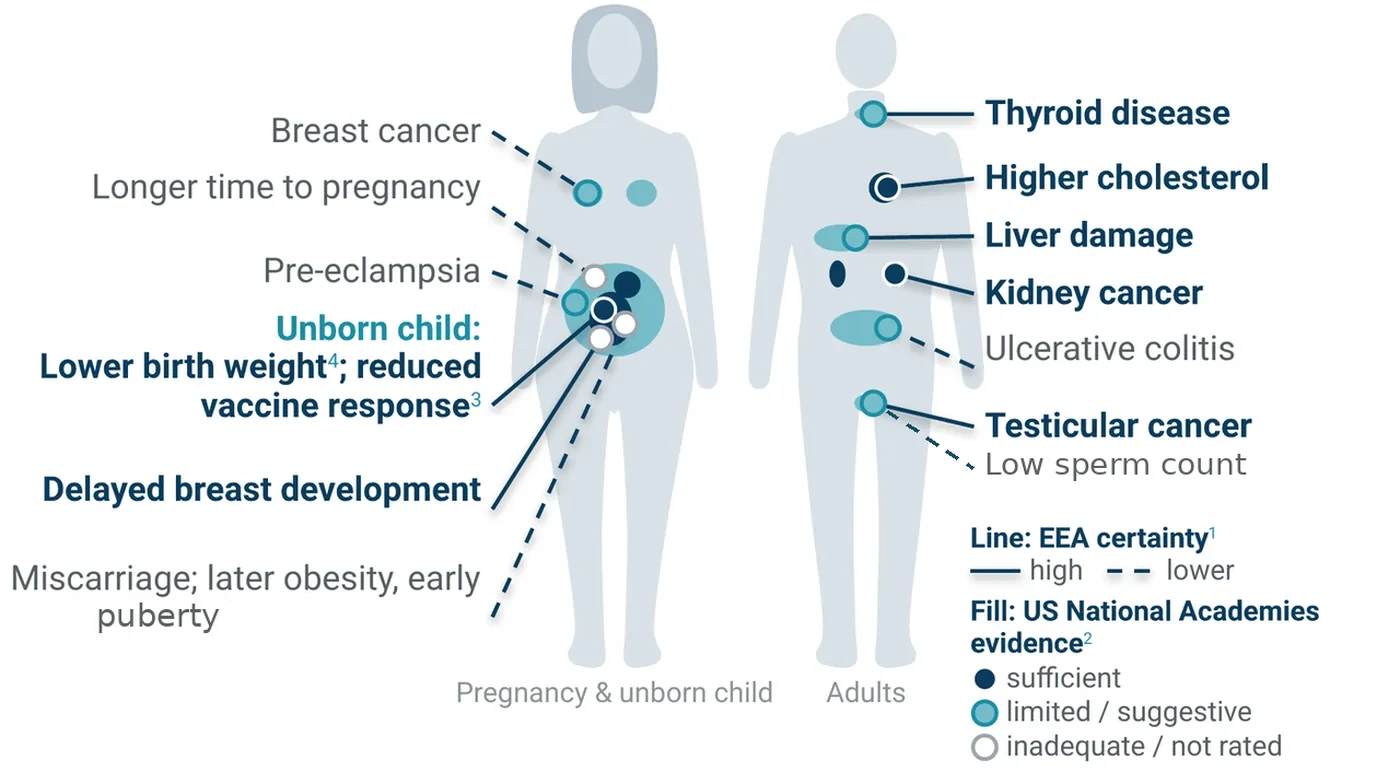
Body map of health effects linked to PFAS. Pregnancy and unborn child: breast cancer, longer time to pregnancy, pre-eclampsia, lower birth weight, reduced vaccine response, delayed breast development, miscarriage, later obesity, early puberty. Adults: low sperm count, thyroid disease, higher cholesterol, liver damage, kidney cancer, ulcerative colitis and testicular cancer.
In us: PFAS are in over 98% of US blood samples and stay for years. Lines: EEA certainty. Fill: US National Academies evidence.
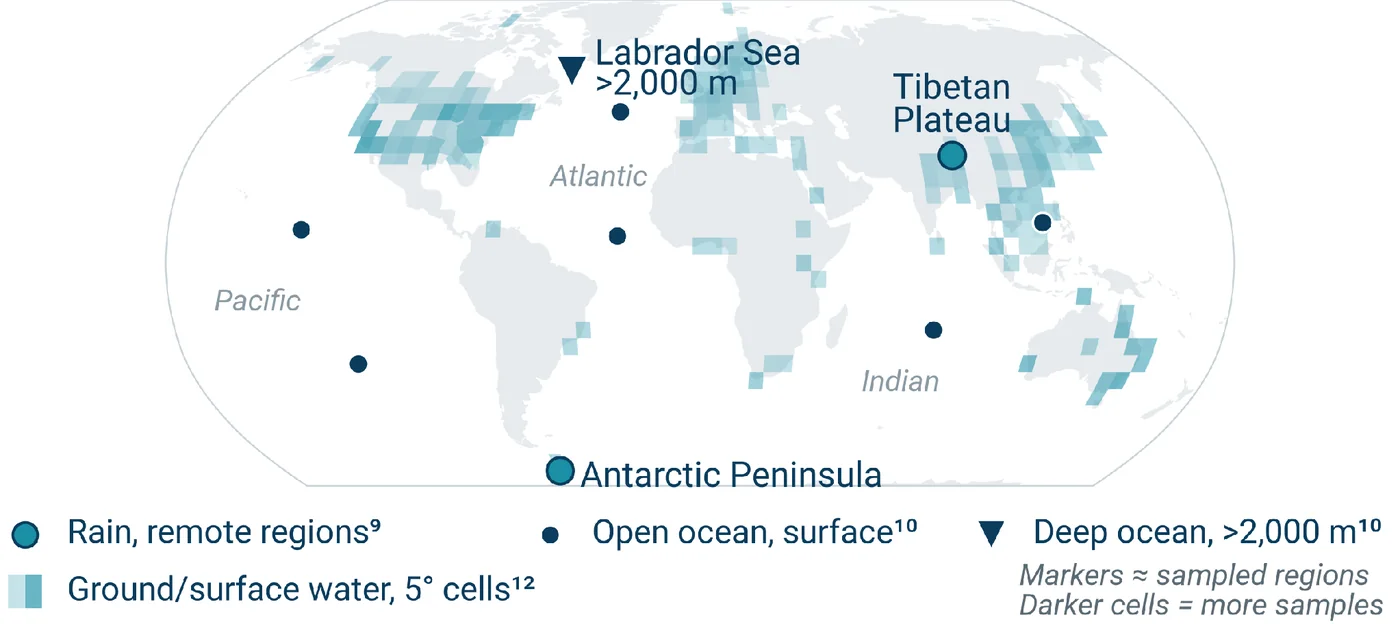
World map of PFAS findings: rain in remote regions including the Tibetan Plateau and the Antarctic Peninsula, open-ocean surface water in the Atlantic, Pacific and Indian oceans, deep ocean water below 2,000 m in the Labrador Sea, ground and surface water cells across North America, Europe and Asia.
Around and under us: remote rain above the strictest guidelines9, oceans10, soil at nearly every site11, groundwater often above EPA limits12.

Body map redrawn by IonicH2O. Sources: 1 EEA, Emerging chemical risks: PFAS (2019); 2 US National Academies (2022); 3 Grandjean et al., JAMA 307, 391 (2012); 4 Maisonet et al., EHP 120, 1432 (2012); Calafat et al., EHP 115, 1596 (2007); Li et al., OEM 75, 46 (2018); 9 Cousins et al., ES&T 56, 11172 (2022); 10 Yamashita et al., Mar. Pollut. Bull. 51, 658 (2005) and Chemosphere 70, 1247 (2008); 11 Brusseau et al., STOTEN 740, 140017 (2020); 12 Ackerman Grunfeld et al., Nat. Geosci. 17, 340 (2024).

The problem

A lasting need

Science
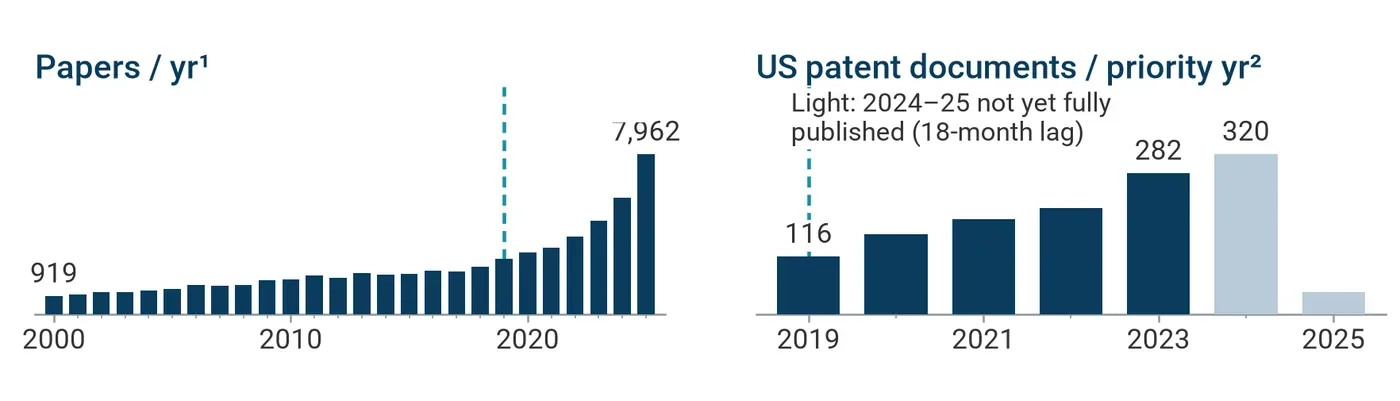
Two bar charts. Papers mentioning PFAS per year rose from 919 in 2000 to 7,962 in 2025. US patent documents by priority year rose from 116 in 2019 to 282 in 2023 and 320 in 2024; 2024 and 2025 are shown light because they are not yet fully published.
Papers: 919 (2000) to 7,962 (2025). Patents keep climbing.

Rules

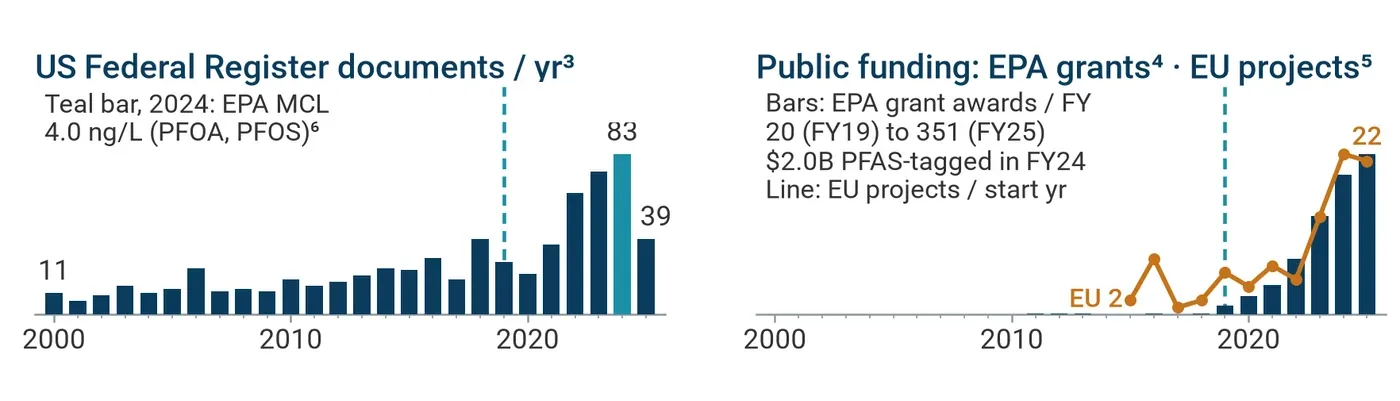
Two charts. US Federal Register documents on PFAS per year: 11 in 2000, a peak of 83 in 2024 when EPA set the 4.0 ng/L limits, and 39 in 2025. EPA grant awards rose from 20 in FY2019 to 351 in FY2025, and EU research projects from 2 to 22.
Federal Register documents peaked at 83 in 2024; EPA grants rose from 20 to 351 a year.

Costs

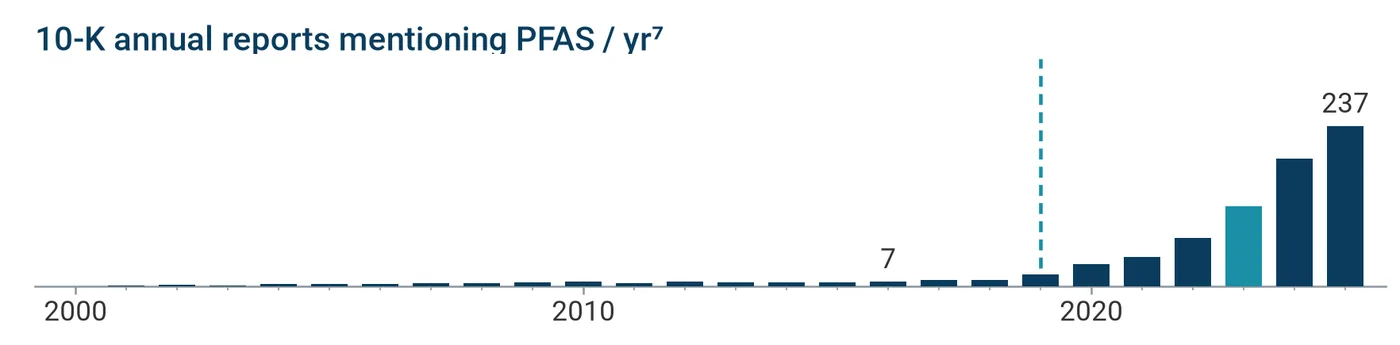
Bar chart of 10-K annual reports mentioning PFAS per year: 7 in 2016, rising to 237 in 2025. The 2023 bar is highlighted for public-water-system settlements.
10-K mentions: 7 (2016) to 237 (2025). Teal: 2023 water-system settlements.

Public

Films, videos and investigations about PFAS, 2015 to 2025Nine films and videos from January 2018 to May 2025 above the line, and eight major-outlet investigations from May 2015 to May 2024 below it.201520172019202120232025● Films and videos (9)○ Major investigations (8)
9 films and videos, 8 investigations; 53M+ video views.

Dashed line: Dec 2019. IonicH2O counts from public databases, Oct 11, 2026. Costs and Public: based on IonicH2O research and discussions with engineering and strategic partners.

Sources: 1 OpenAlex, title/abstract; 2 Google Patents, US documents by priority year; 3 FederalRegister.gov; 4 USAspending.gov, EPA grant awards by FY; 5 CORDIS, EU projects by start year; 6 US EPA, 89 FR 32532 (2024); 7 SEC EDGAR full-text search, 10-K by filing year.

Health effects

According to the US EPA, peer-reviewed studies show exposure to certain levels of PFAS may lead to:

  • Reproductive effects, such as decreased fertility or high blood pressure in pregnancy.
  • Developmental effects in children, including low birth weight.
  • Higher risk of some cancers, including prostate, kidney and testicular.
  • Reduced immune response.
  • Interference with natural hormones.
  • Higher cholesterol and/or risk of obesity.

Source: US EPA, Our Current Understanding of the Human Health and Environmental Risks of PFAS; EEA, Emerging chemical risks in Europe: PFAS.

Tiny amounts of PFAS foul water supplies

At the EU limit of 100 ng/L for 20 PFAS, an Olympic pool (2,500 m³) could hold only about 0.25 g, roughly three drops.

100 ng/L × 2,500,000 L = 0.25 g. Directive (EU) 2020/2184.

Where PFAS are found in Europe

Hotspots: chemical plants; airports, firefighting training areas and military bases; industrial sites; and farmland where biosolids are spread.
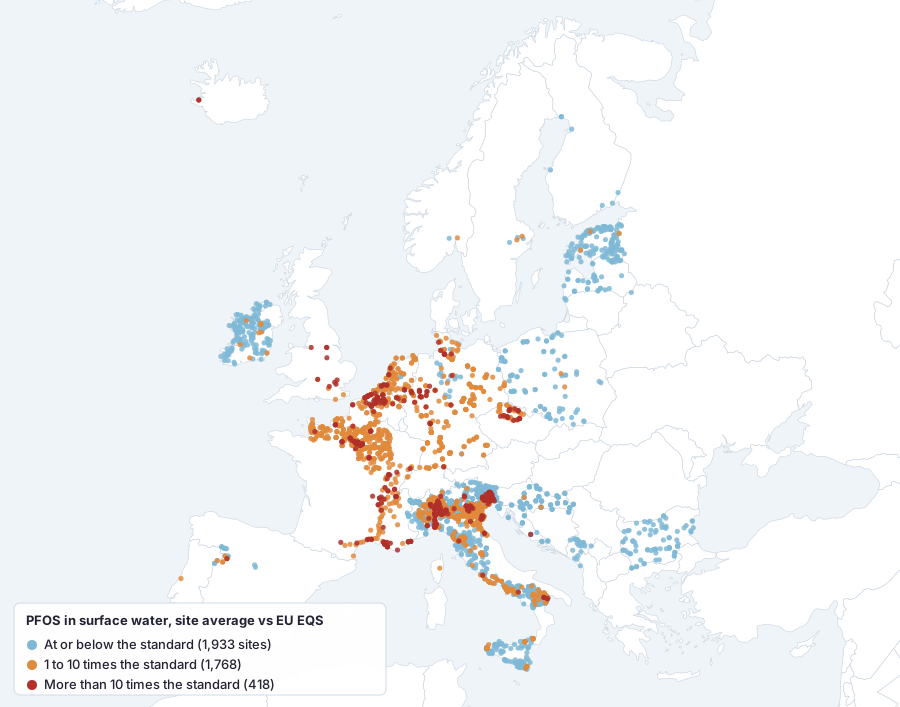
Map of Europe showing about 4,100 surface water monitoring sites. Many sites in Belgium, the Netherlands, France, Germany and northern Italy have PFOS averages above the EU standard; sites in Ireland, Finland, the Baltic states and southeastern Europe are mostly at or below it.
PFOS in European surface waters, 2018–2022, by site average vs the EU standard: 2,186 of 4,119 sites in 20 countries were above it. No dot means no data, not no PFAS. IonicH2O map of EEA Waterbase data (EEA briefing), CC BY 4.0. Outlines: Natural Earth.

Where PFAS are found in the United States

In EPA's UCMR 5 testing for 29 PFAS, about 35% of reporting systems (3,595 of 10,312) had at least one PFAS at or above the minimum reporting level. EPA estimates about 7.8% of systems nationwide had an average above the 2024 limit.
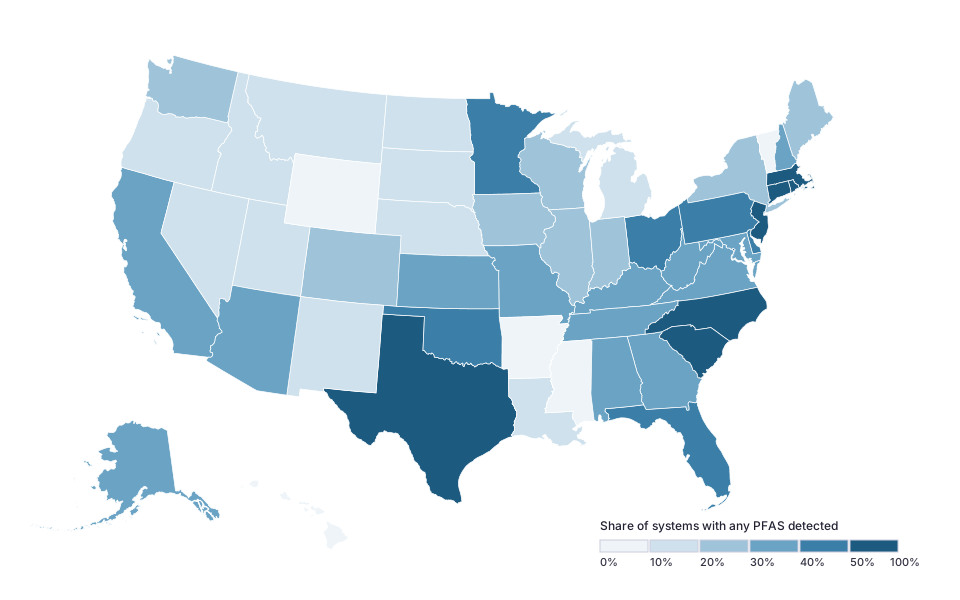
US map by state showing the share of public water systems that reported at least one PFAS at or above the UCMR 5 minimum reporting level. Shares are highest in parts of the Northeast, the Carolinas and Texas.
Share of systems per state with at least one PFAS at or above the reporting level. IonicH2O analysis of EPA UCMR 5 data (summary July 2026), downloaded Nov 3, 2026; outlines: US Census Bureau. A detection is not a violation; smaller systems were sampled.

Source: US EPA, UCMR 5 Data Summary, July 2026.