
Results
Tested at bench and field scale
What we have tested
- Bench studies by an independent engineering firm on GAC from different sources.
- Repeat regeneration of the same carbon over several cycles.
- A field system at a US municipal water utility.
- A scaled-up field test on groundwater affected by firefighting foam.
Want the full picture? We share detailed performance data and field system results directly with prospective partners.
Bench-test results
Regenerated carbon takes up PFAS again
Side by side under the same conditions, regenerated carbon took up PFAS at a level comparable with fresh carbon in our bench tests.
Model prediction
Regeneration within a work shift
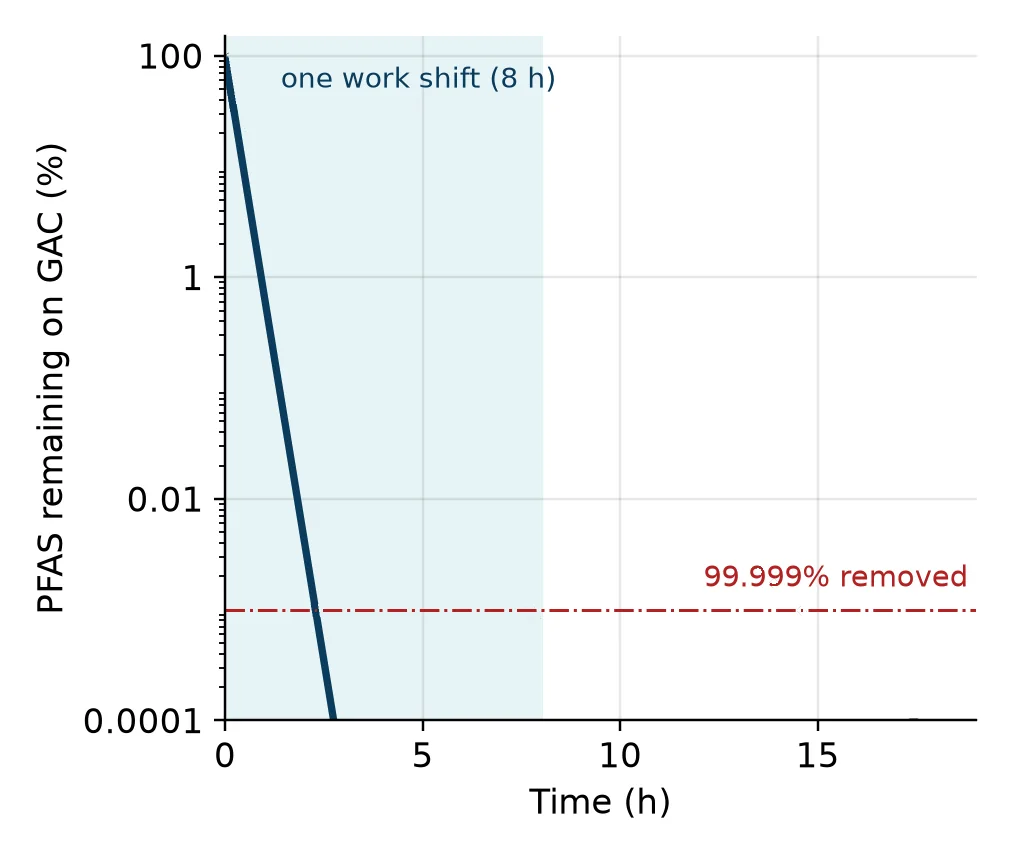
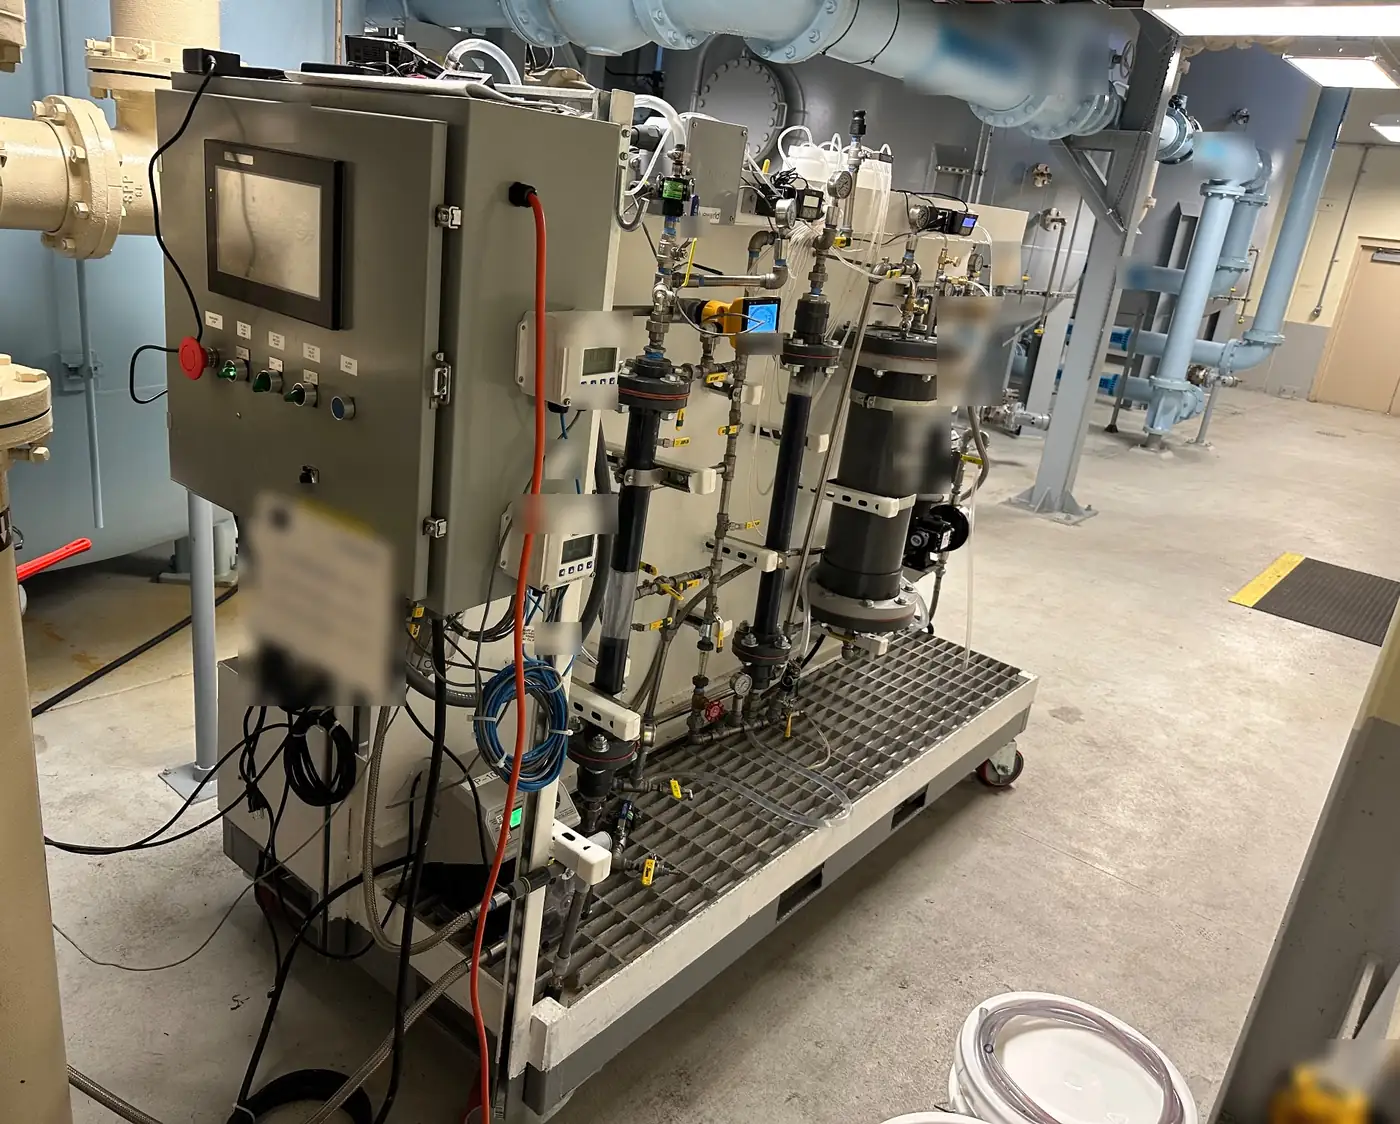
1 IonicH2O regeneration model, internal report (2026), flow-optimized design case. A model prediction, not a measured result. Photo: Michael Oster, IonicH2O; labels blurred.
Lower cost. Less waste. Less carbon.
>50% cost savings for a stationary or central regeneration system compared with conventional GAC treatment for a 2.4 MGD (379 m³/h) system, based on a cost model developed with a utility partner.
For a mobile system, savings are potentially greater than 70% (management estimate).
Life-cycle cost for a 2.4 MGD (380 m³/h) system
Over 20 years, an optimized Ionic system halves total cost, mostly through operating costs.
| Life-cycle cost, present value | Current GAC systems1 | Ionic optimized systems2 | Savings |
|---|---|---|---|
| Total lifetime costs | $13.3M | $6.6M | −50% |
| Capital expenditures | $7.2M | $5.4M | −25% |
| Operating expenses | $6.1M | $1.3M | −79% |
1. Cost comparison of average 2.4 MGD GAC-based PFAS removal systems over a 20-year life cycle, from water treatment utility benchmarks. 2. Based on IonicH2O expenses for system development and operations, validated with water treatment companies.
Cost per tank change-out
| Per 20,000 lb (9,000 kg) tank | Traditional change-out | Ionic mobile regeneration |
|---|---|---|
| New GAC media | ~$32–40k (thermal regeneration or virgin) | $0 |
| Transport in (half-full dry media tank) | ~$3–5k (by distance) | Empty tank only |
| Transport out (wet media, twice the weight) | ~$3–20k (by destination) | Empty tank, plus a little concentrated PFAS held in filters |
| Disposal | Landfill ~$3k; incineration ~$28k | A fraction, for a small volume |
| Make-up media (fines lost) | ~15% ($4.5–6k) | ~1% ($400, about 200 lb) |
| Consumables | $0 | Under $1k, plus under $4k for filters |
- Twice the volume per truck: each empty tank regenerates one to four customer tanks.
- Flexible: one visit services four 10,000 lb or two 20,000 lb tanks.
Source: IonicH2O internal market analysis; traditional costs are IonicH2O estimates.
Mobile-system estimates
Fluorinse™ complements, rather than competes with, emerging PFAS destruction technologies: it gives them far less to destroy.
- Less than 8 hours on site overall.
- Only the filters leave All PFAS is caught in filters, cleaned or destroyed on site, on a trailer or at a central plant.
- Site water only reused step to step and, in many cases, discharged locally.
- Low media loss from slurry loading and a fluidized-bed process.
- Familiar service much like a change-out today.
Source: IonicH2O system concept and estimates.
Waste and supply chain
The PFAS concentrate to destroy is orders of magnitude smaller than the spent carbon, so destruction and landfill are easier to size. Keeping the same carbon in service also means buying less new GAC. Compare technologies
Carbon footprint
No carbon trucked in or out, no reactivation and no new carbon each cycle.
Estimated CO2 per kg of GAC over 10 years vs traditional GAC handling.
Initial GAC production
Reactivation, each cycle
Transport, each cycle
Regeneration consumables
Destruction (if not reactivated)
Source: IonicH2O estimates.